NASA Open Science Gateway
A cloud-based platform to streamline geoscientific research workflows.
Project overview
NASA’s Open Science Gateway (OSG) is a cloud-based platform-as-a-service (PaaS) that supports geoscientists throughout their research journey, from data collection to publishing results.
As a UX designer at the Cyber-Infrastructure Integration Research Center, I collaborated with NASA Earth scientists to create a north-star concept for the platform.
Timeline
3.5 months
Team
1 UX Designer
1 UX Researcher
1 Product Manager
3 Developers
Role
UX Designer
Tools
Figma
Microsoft 365
Platform
Web application
Status
Shipped
Contribution (0 -> 1)
Primary research
Concept ideation
Prototyping
High-fidelity designs
Testing
Problem context
Geoscientists had complex workflows, often juggling multiple tools, datasets, and applications that slowed their progress.
The PM, who is also a research himself, shared stats showing how fragmented tools, manual processes, and collaboration issues affected research efficiency and output quality.

42%
Time spent on data management
Scientists spend nearly half their time managing data across platforms instead of conducting research.
380 hours
Lost annually
Research teams lose hundreds of hours to manual data conversion and report generation each year.
67%
Project delays
Two-thirds of teams report delays due to collaboration barriers and lack of centralized tools.
28%
Document consistency
Only about a quarter of research projects maintain consistent documentation across their lifecycle.
Core challenge
How might we streamline the scientific research workflow so that geoscientists can spend less time managing tools and more time advancing their research?
Solution highlights
Unifying fragmented research tools into a single workspace, enabling scientists to focus more on discovery and less on process.
Unified project management
Comprehensive project dashboard
Integrated simulations
Real-time collaboration
Intuitive report generation
Research
Geoscientific research was completely new to me, so I collaborated with a UX researcher and interviewed 5 scientists, asking them to explain their research process.
Observing how these scientists identify and approach research problems, the tools they use, and their methods for finding relevant datasets to build hypotheses answered many of our questions and helped us identify existing gaps.
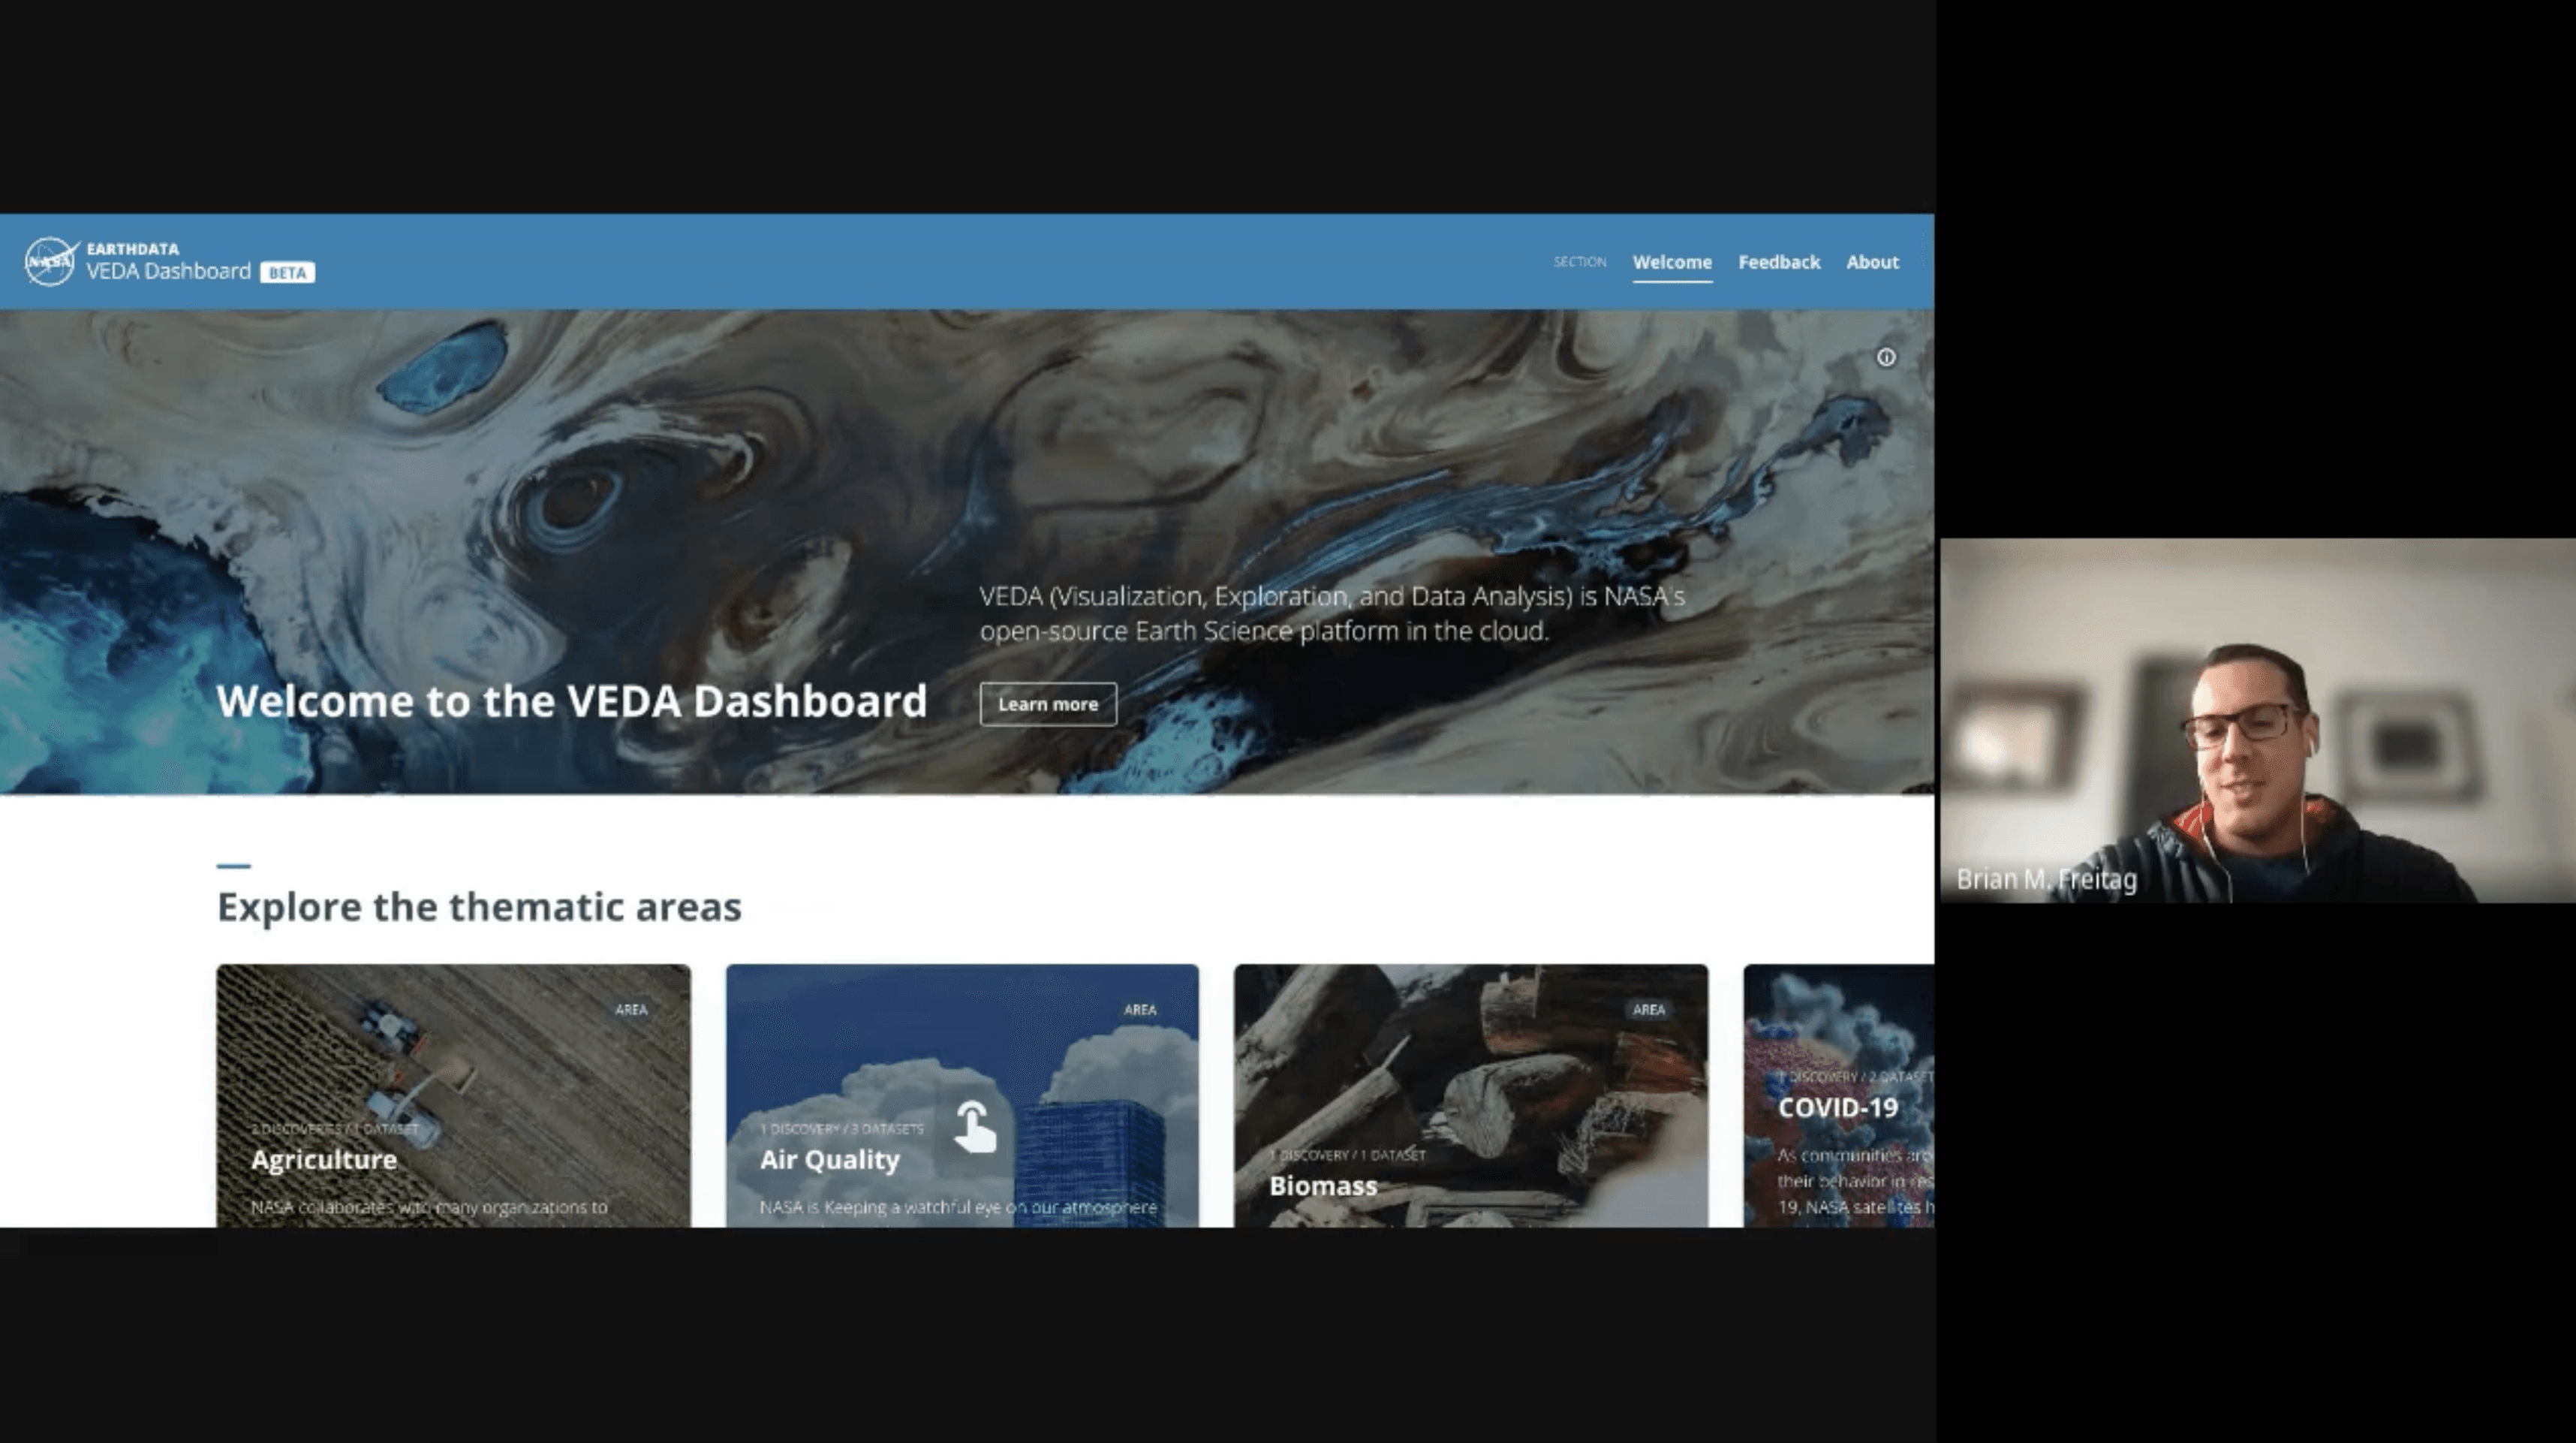
From the interview data, we identified five key problems contributing to the challenges scientists faced.
supervised_user_circle_off
Collaboration challenges
Remote collaboration over the cloud is difficult, with poor task accountability.
draft
Difficulty in generating reports
Researchers lack an intuitive tool for creating and sharing insights.
public_off
Less to no automation
Converting raw data for simulations is time-consuming and manual.
Synthesis
I then worked with the developers and PM to pinpoint specific areas for improvement in a typical research workflow.
I identified four main stages that scientists typically go through. For each stage, I mapped out their processes, pain points, and included questions or relevant quotes from the interviews to spark discussion. This provided a solid foundation for generating clear design opportunities.


Ideation
For each of the 4 stages, I proposed a workflow improvement and created task flows to clearly communicate my ideas to the team.
These flows provided a clear understanding of the scope of work, including the number and types of screens needed for the MVP solution.


After a cross-functional crit session, we chose to forgo some of the design ideas I initially came up with due to business, technical, and resource constraints.

Low-fi wirefranes
Once we agreed on the function, I began designing the form, starting with simple wireframes.
I held frequent critique sessions with the developers and PM to review and iterate the designs until we reached a consensus on layout and functionality, leaving aesthetics for later.

Design system
Since we were building this platform from scratch and proposing a north-star vision for it, I had the opportunity to build a custom design system from scratch instead of adhering to NASA's styles.
I looked into several different design systems and styles from industry leaders in SaaS and enterprise software and took some pieces of inspiration.

Contact
Final solution
An open-source, cloud-based platform that simplifies and expedites geoscientific research using automation, project management, and real-time collaboration.
Unified project management
Projects overview
The project overview page organizes complex research initiatives into scannable cards that surface key details about each project's resources and team. The layout prioritizes quick comparison across projects while maintaining easy access to actions and filters scientists need most.

Project creation
A project creation modal streamlines the process of starting new research initiatives by breaking it into logical steps of naming, describing, and building a team. The design maintains simplicity while providing smart features like email suggestions to speed up the collaboration process.
Project details
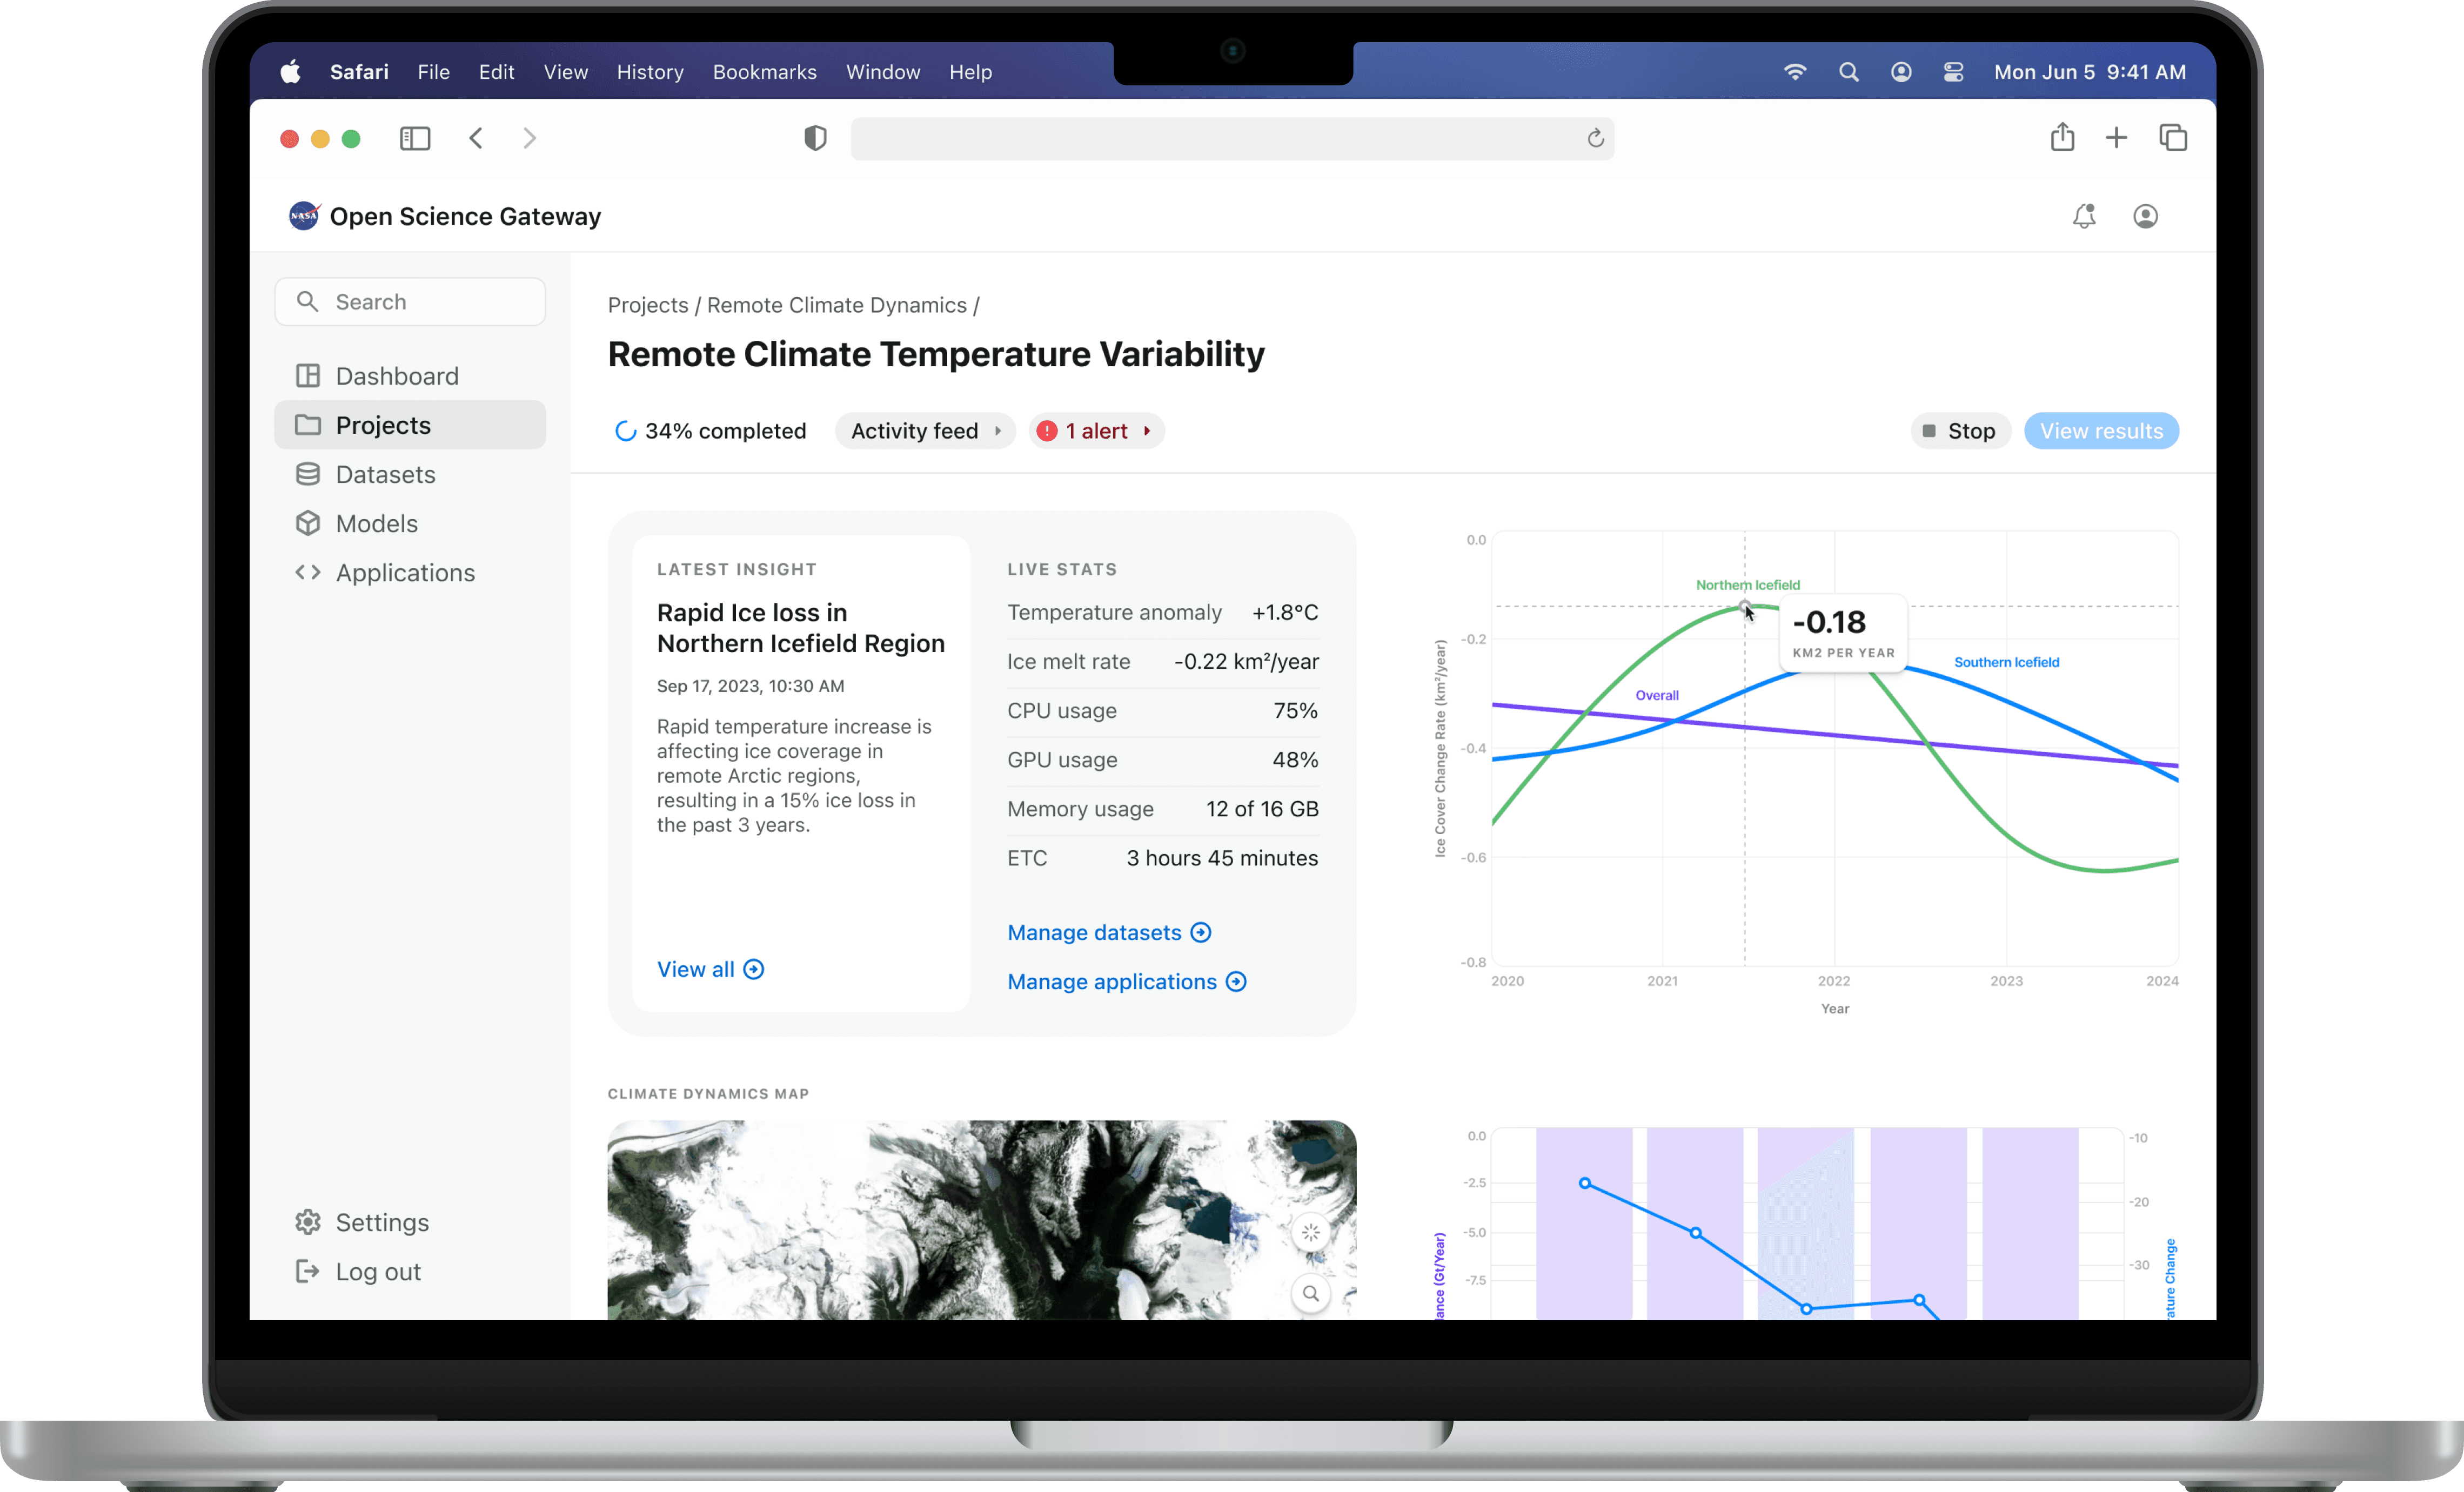
This project details screen combines high-level project metrics with detailed insights and real-time activity tracking. The layout prioritizes data visualization while maintaining easy access to project controls and team collaboration features.
interactive simulations
Simulation creation overview
Users can run complex environmental models in real time. They can adjust parameters, observe immediate changes, and track the progress of their simulations through live updates. The system would automatically gather high-value isights and present them in a sequential manner.
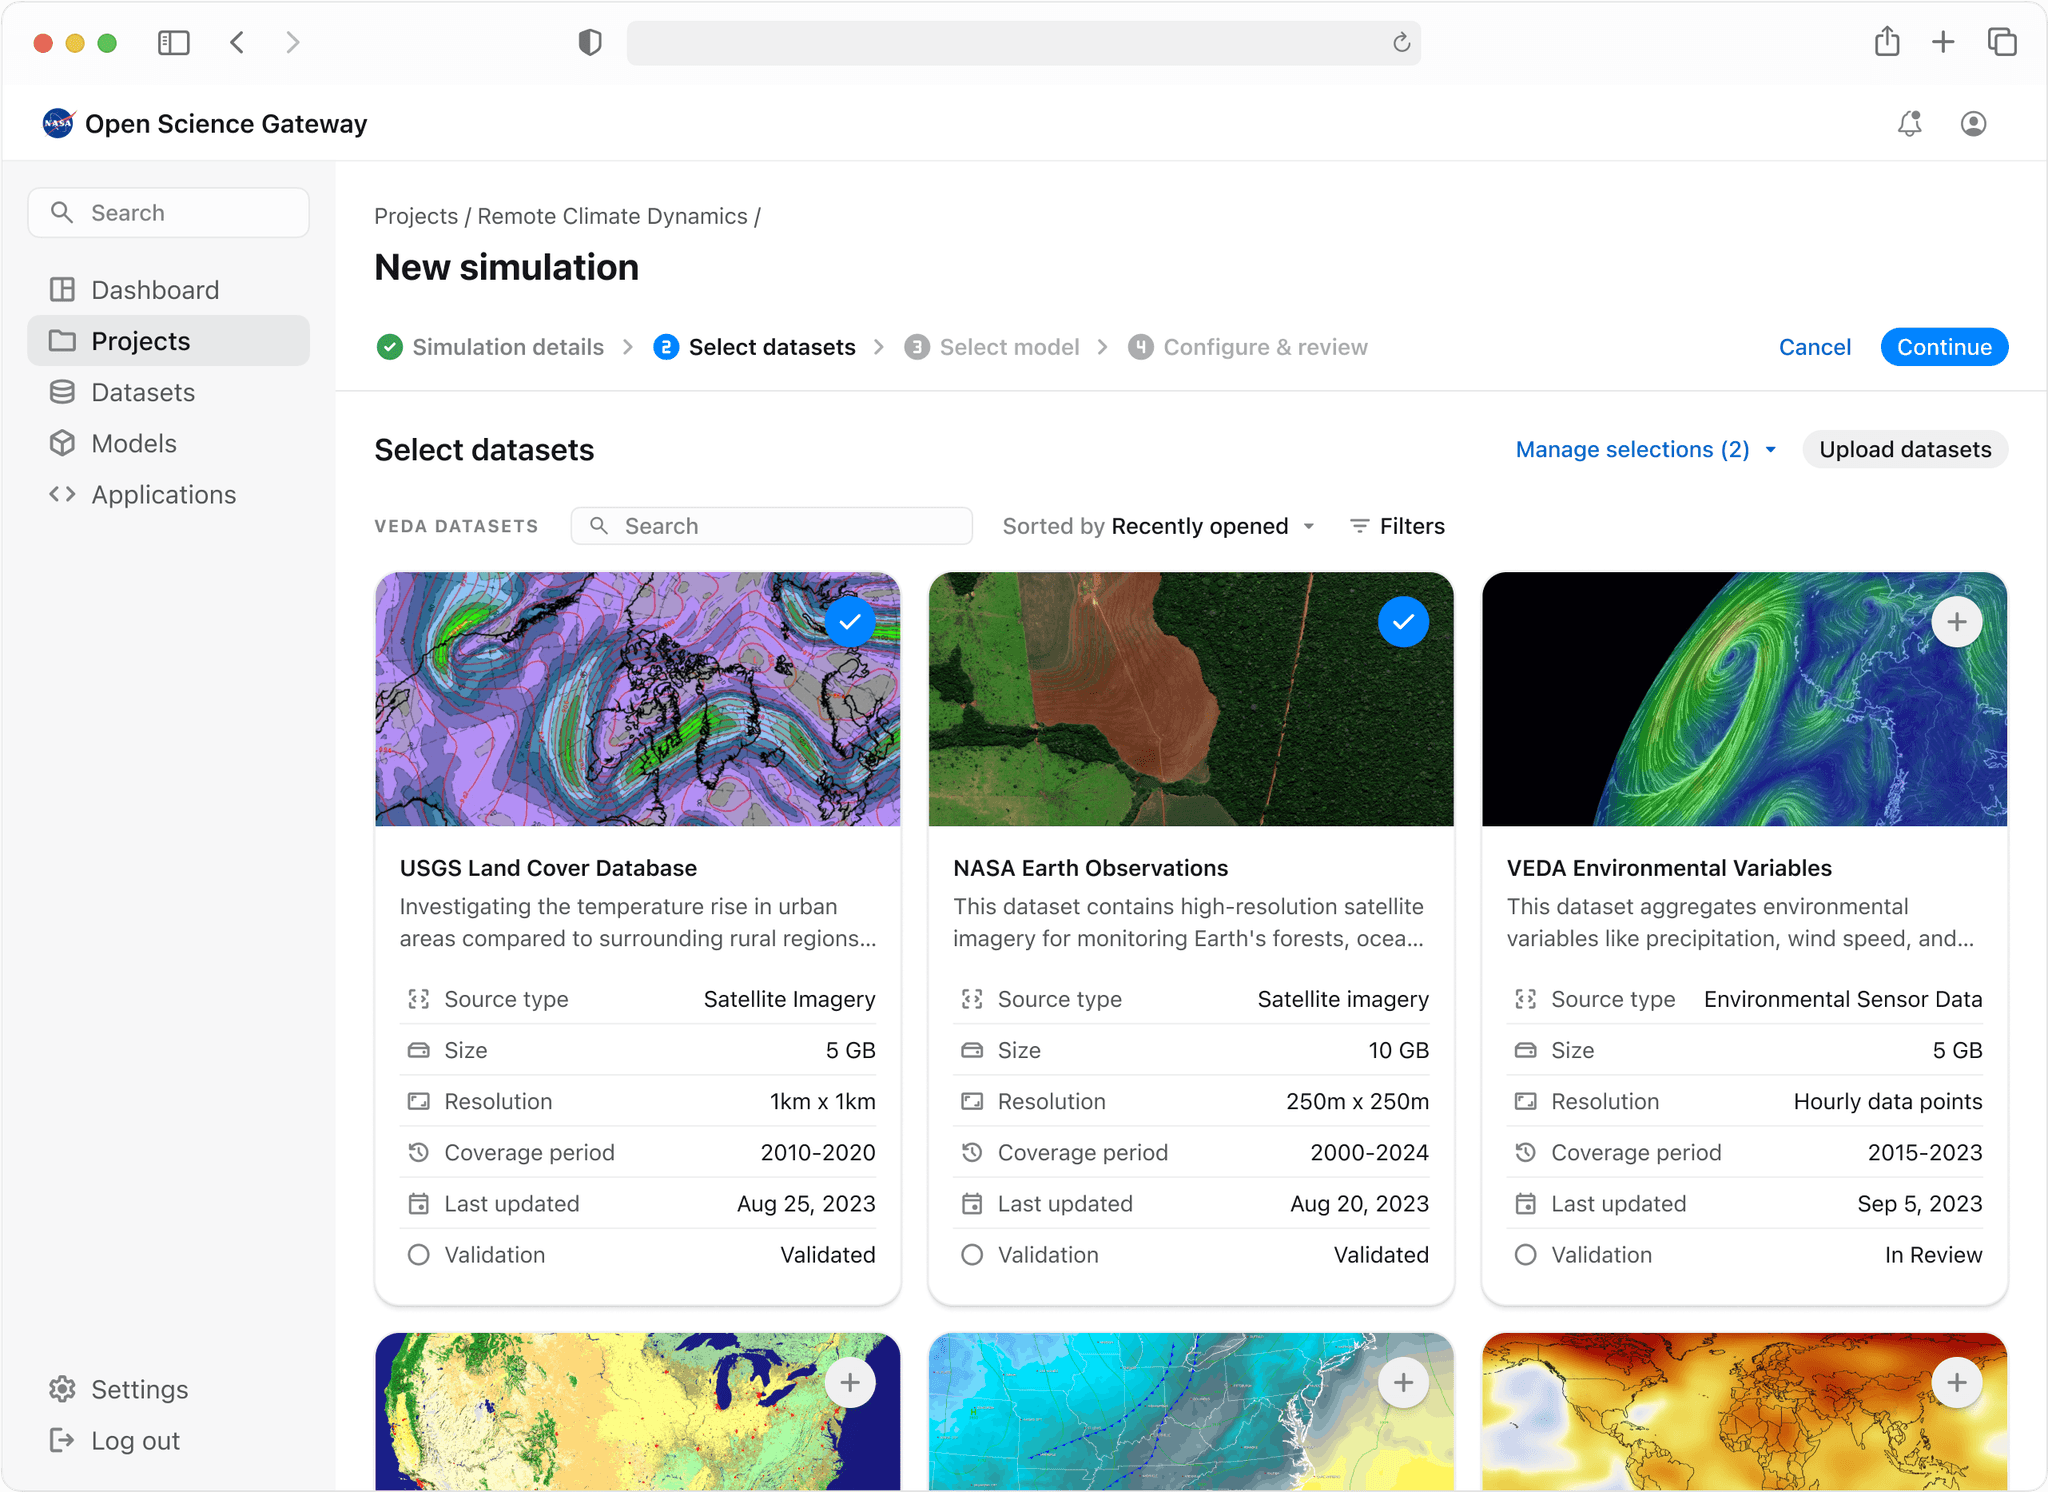
VEDA datasets integration
Researchers can access and integrate NASA's VEDA datasets into their research workflows. With options to upload personal datasets and filter through validated, high-resolution datasets, researchers can curate datasets for simulations quickly, reducing the complexity of sourcing and managing research data.
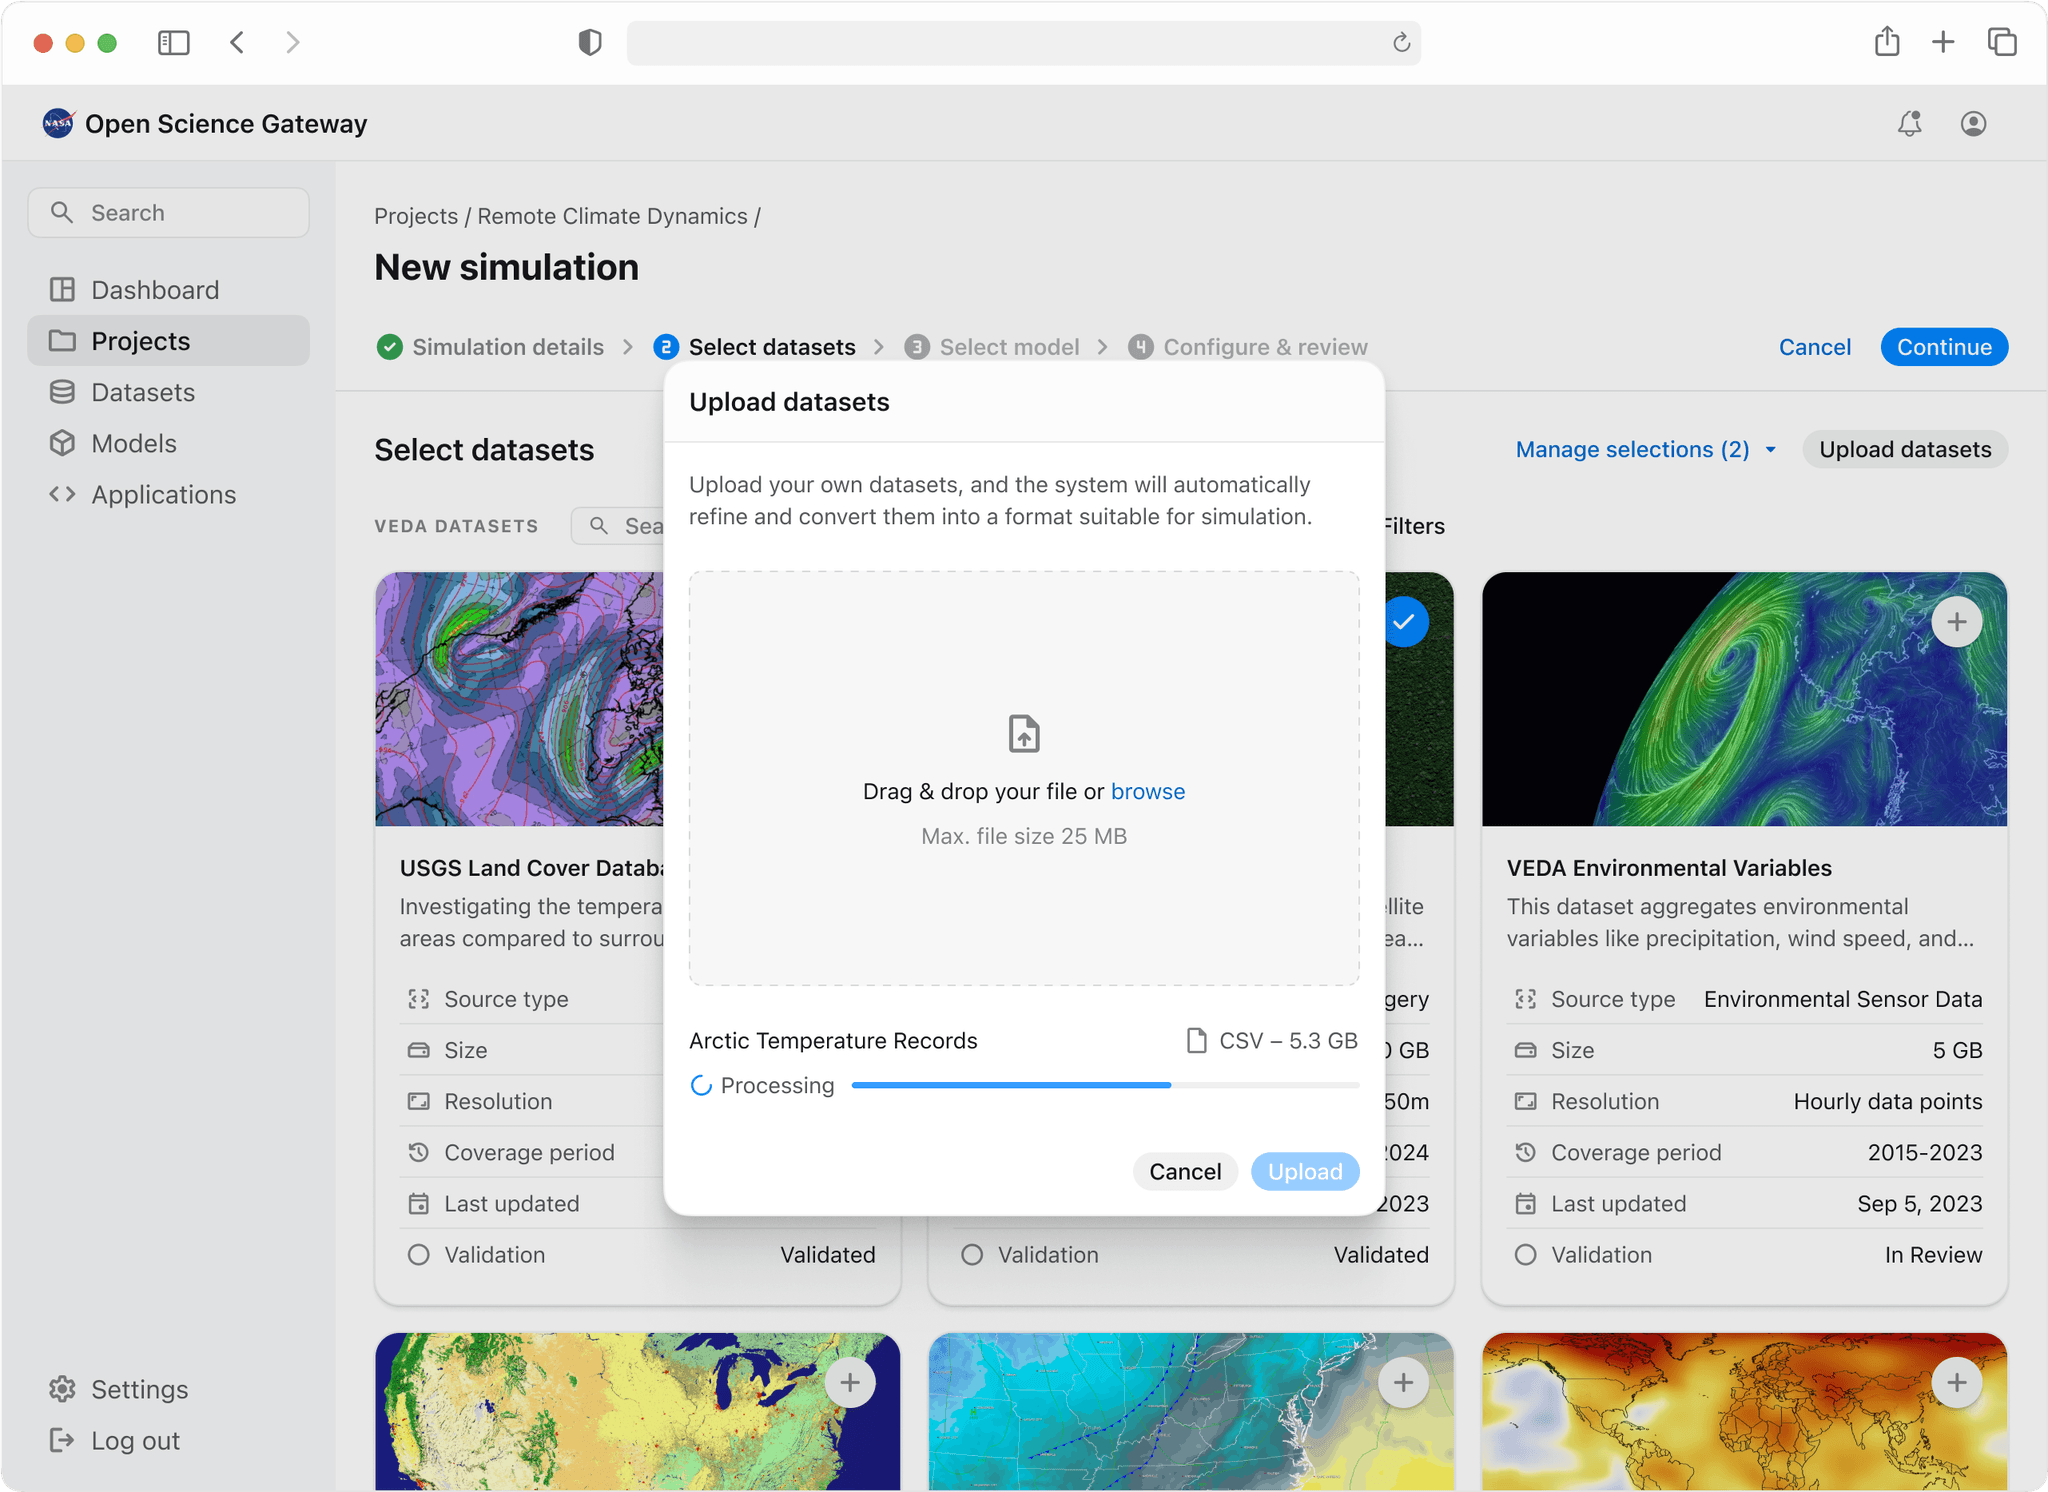
Workflow automation
Users can upload raw data and the platform would automatically process the file to prepare it for further analysis. This automation removes the need for scientists to manually clean, format, or validate data.
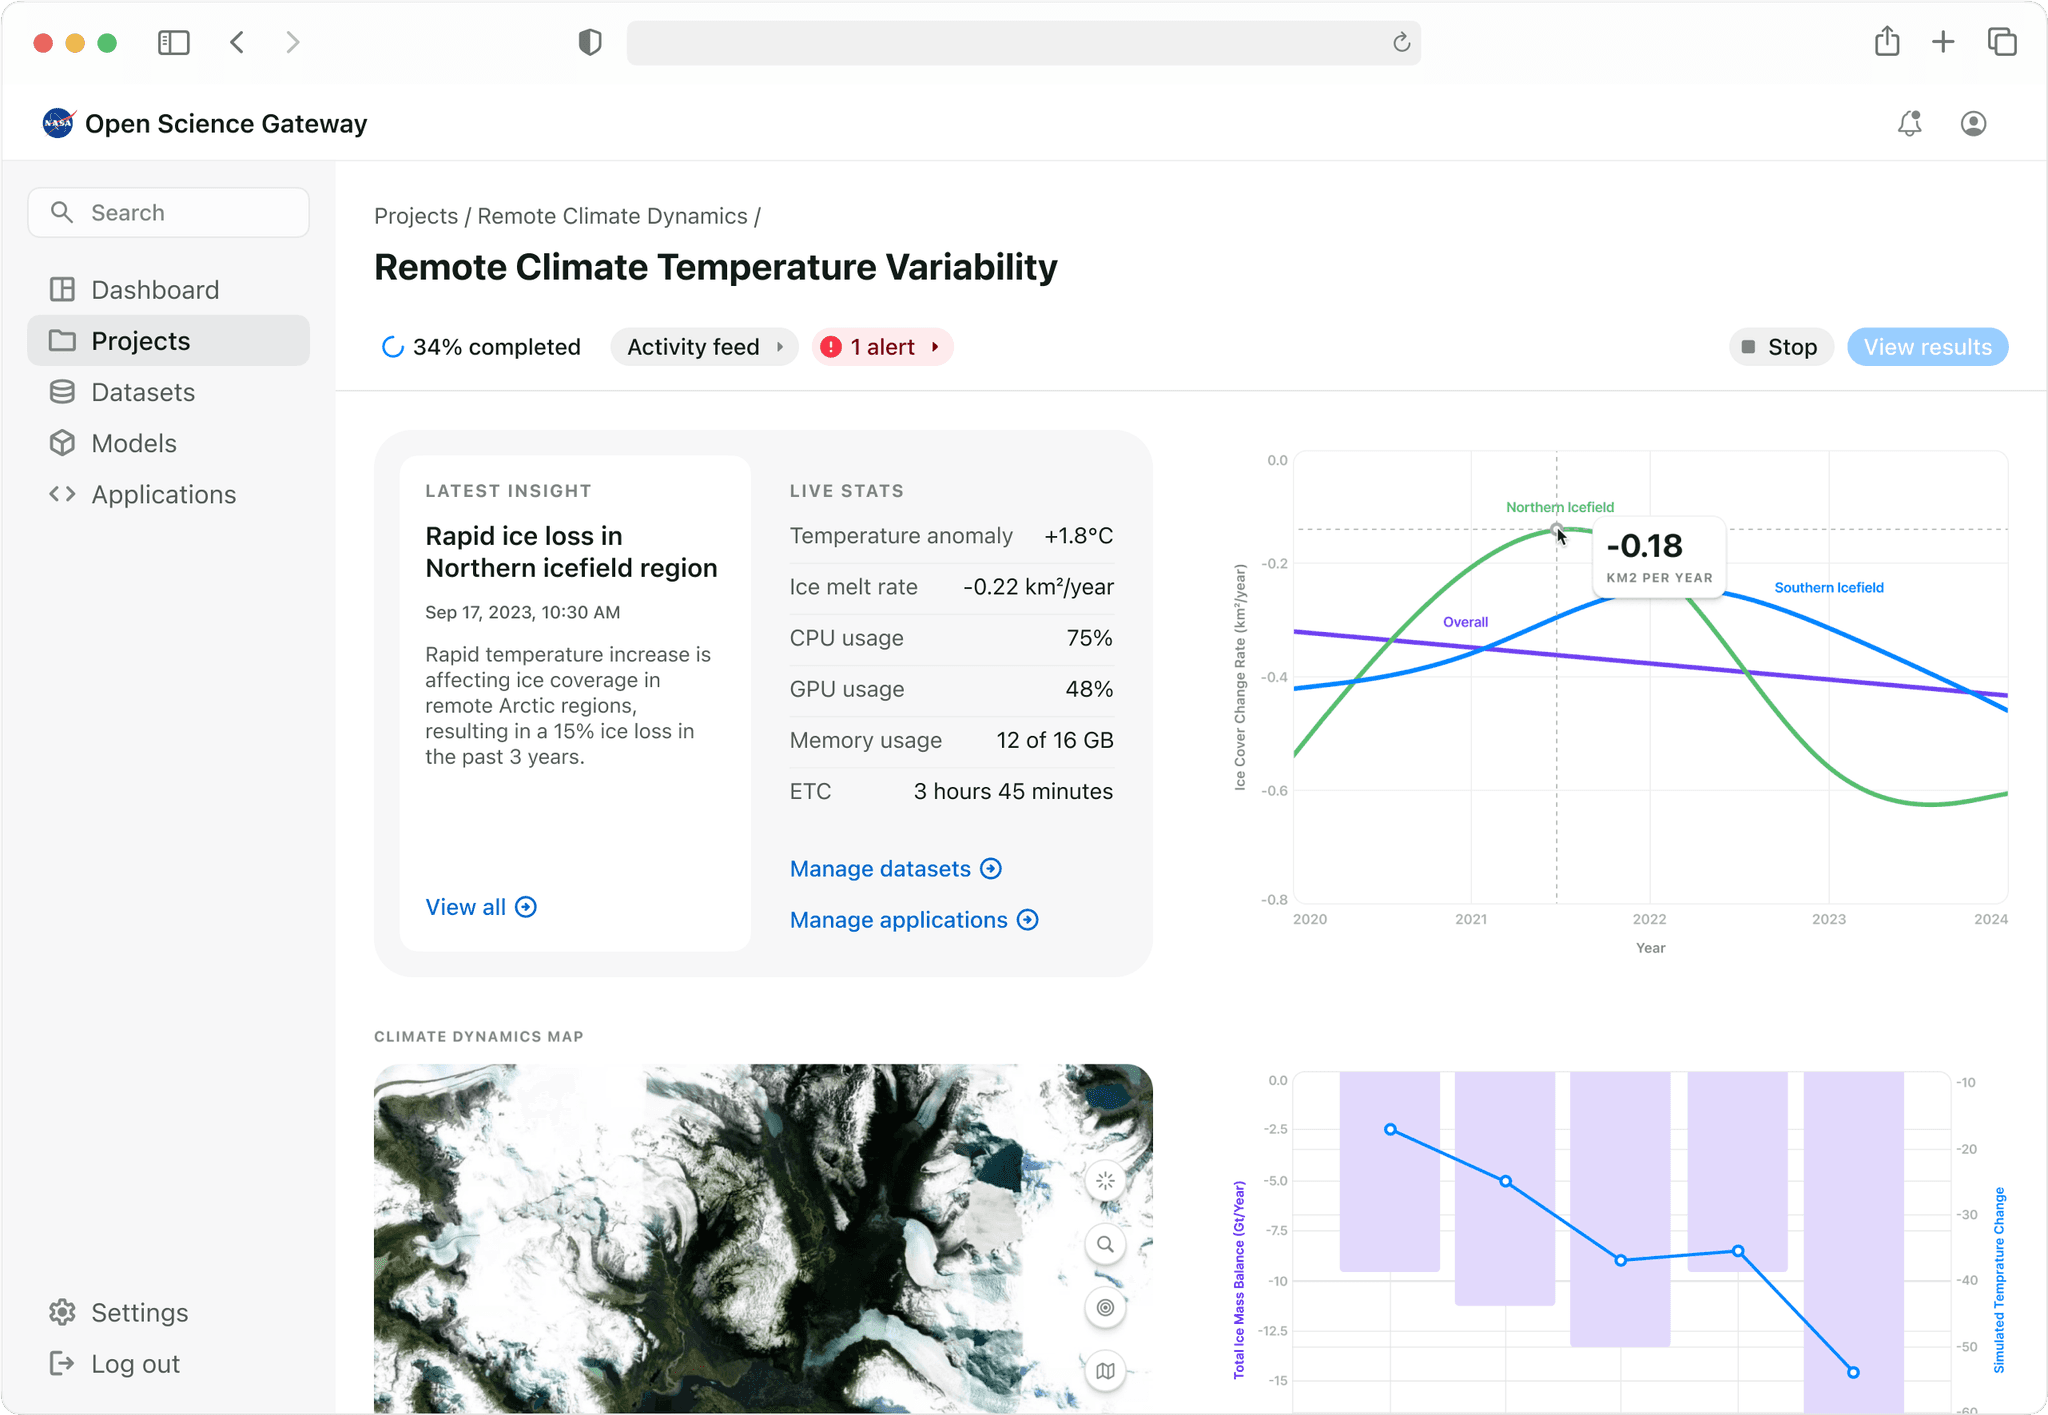
Simulation dashboard
The simulation dashboard merges technical monitoring with scientific insights, allowing researchers to track both computation progress and emerging research findings. With the layout, I tried to prioritize real-time data while maintaining context of the broader research goals.
real-time collaboration
Collaborative report creation
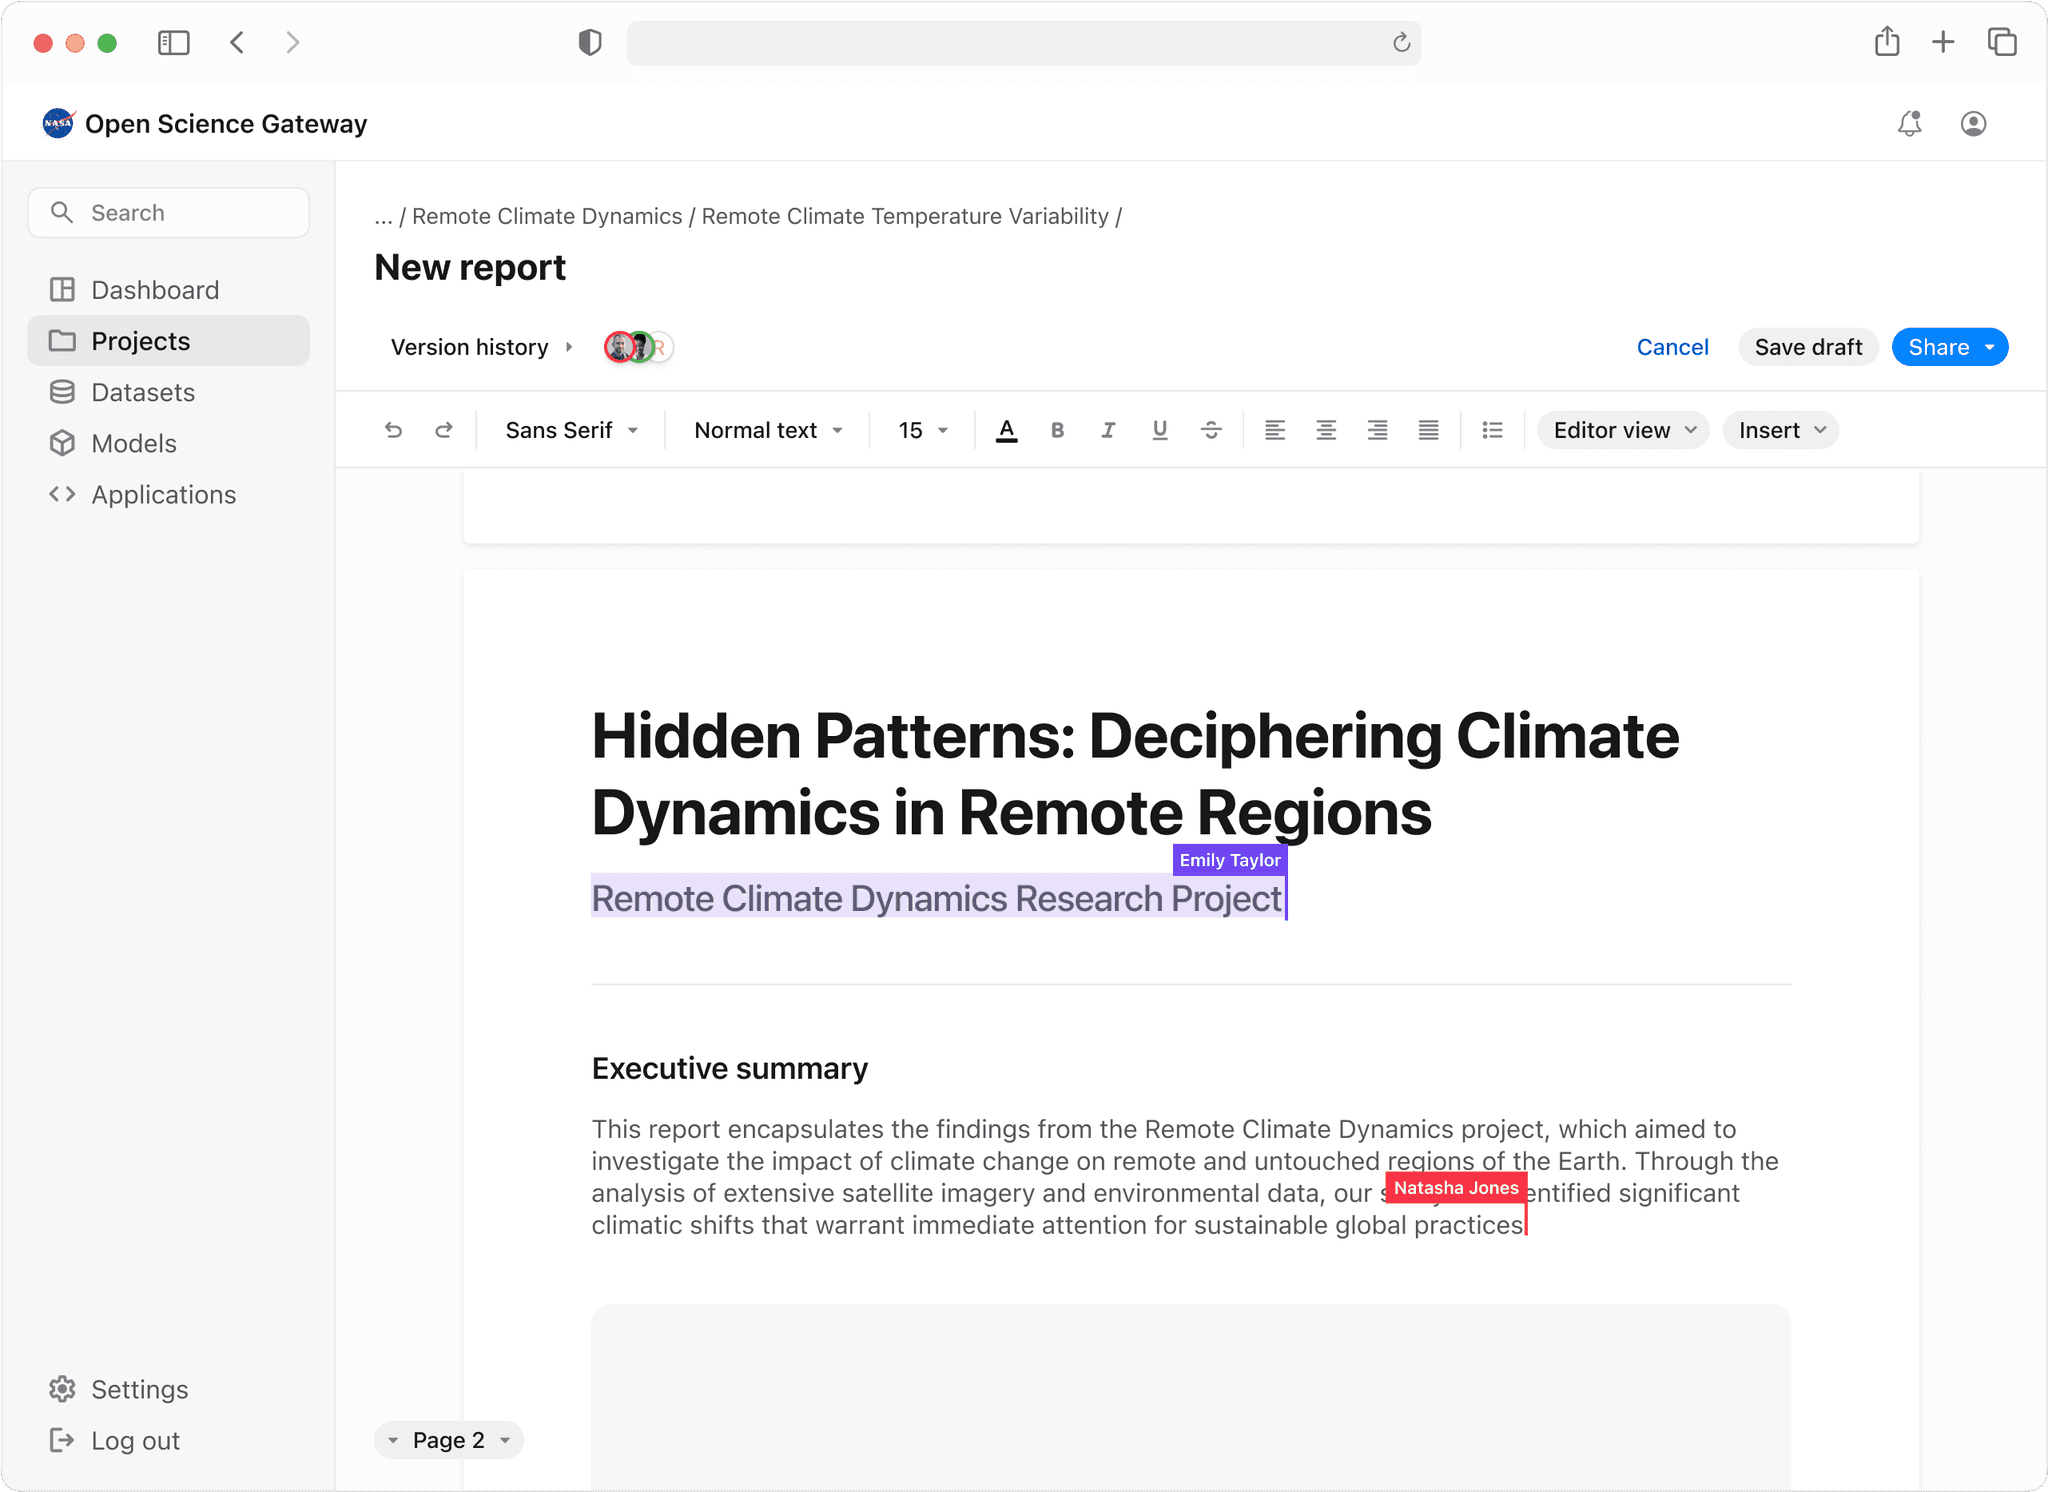
With real-time editing features, multiple collaborators can draft, edit, and finalize research reports on shared projects. Each team member's contributions are visible, and version history ensures transparency.

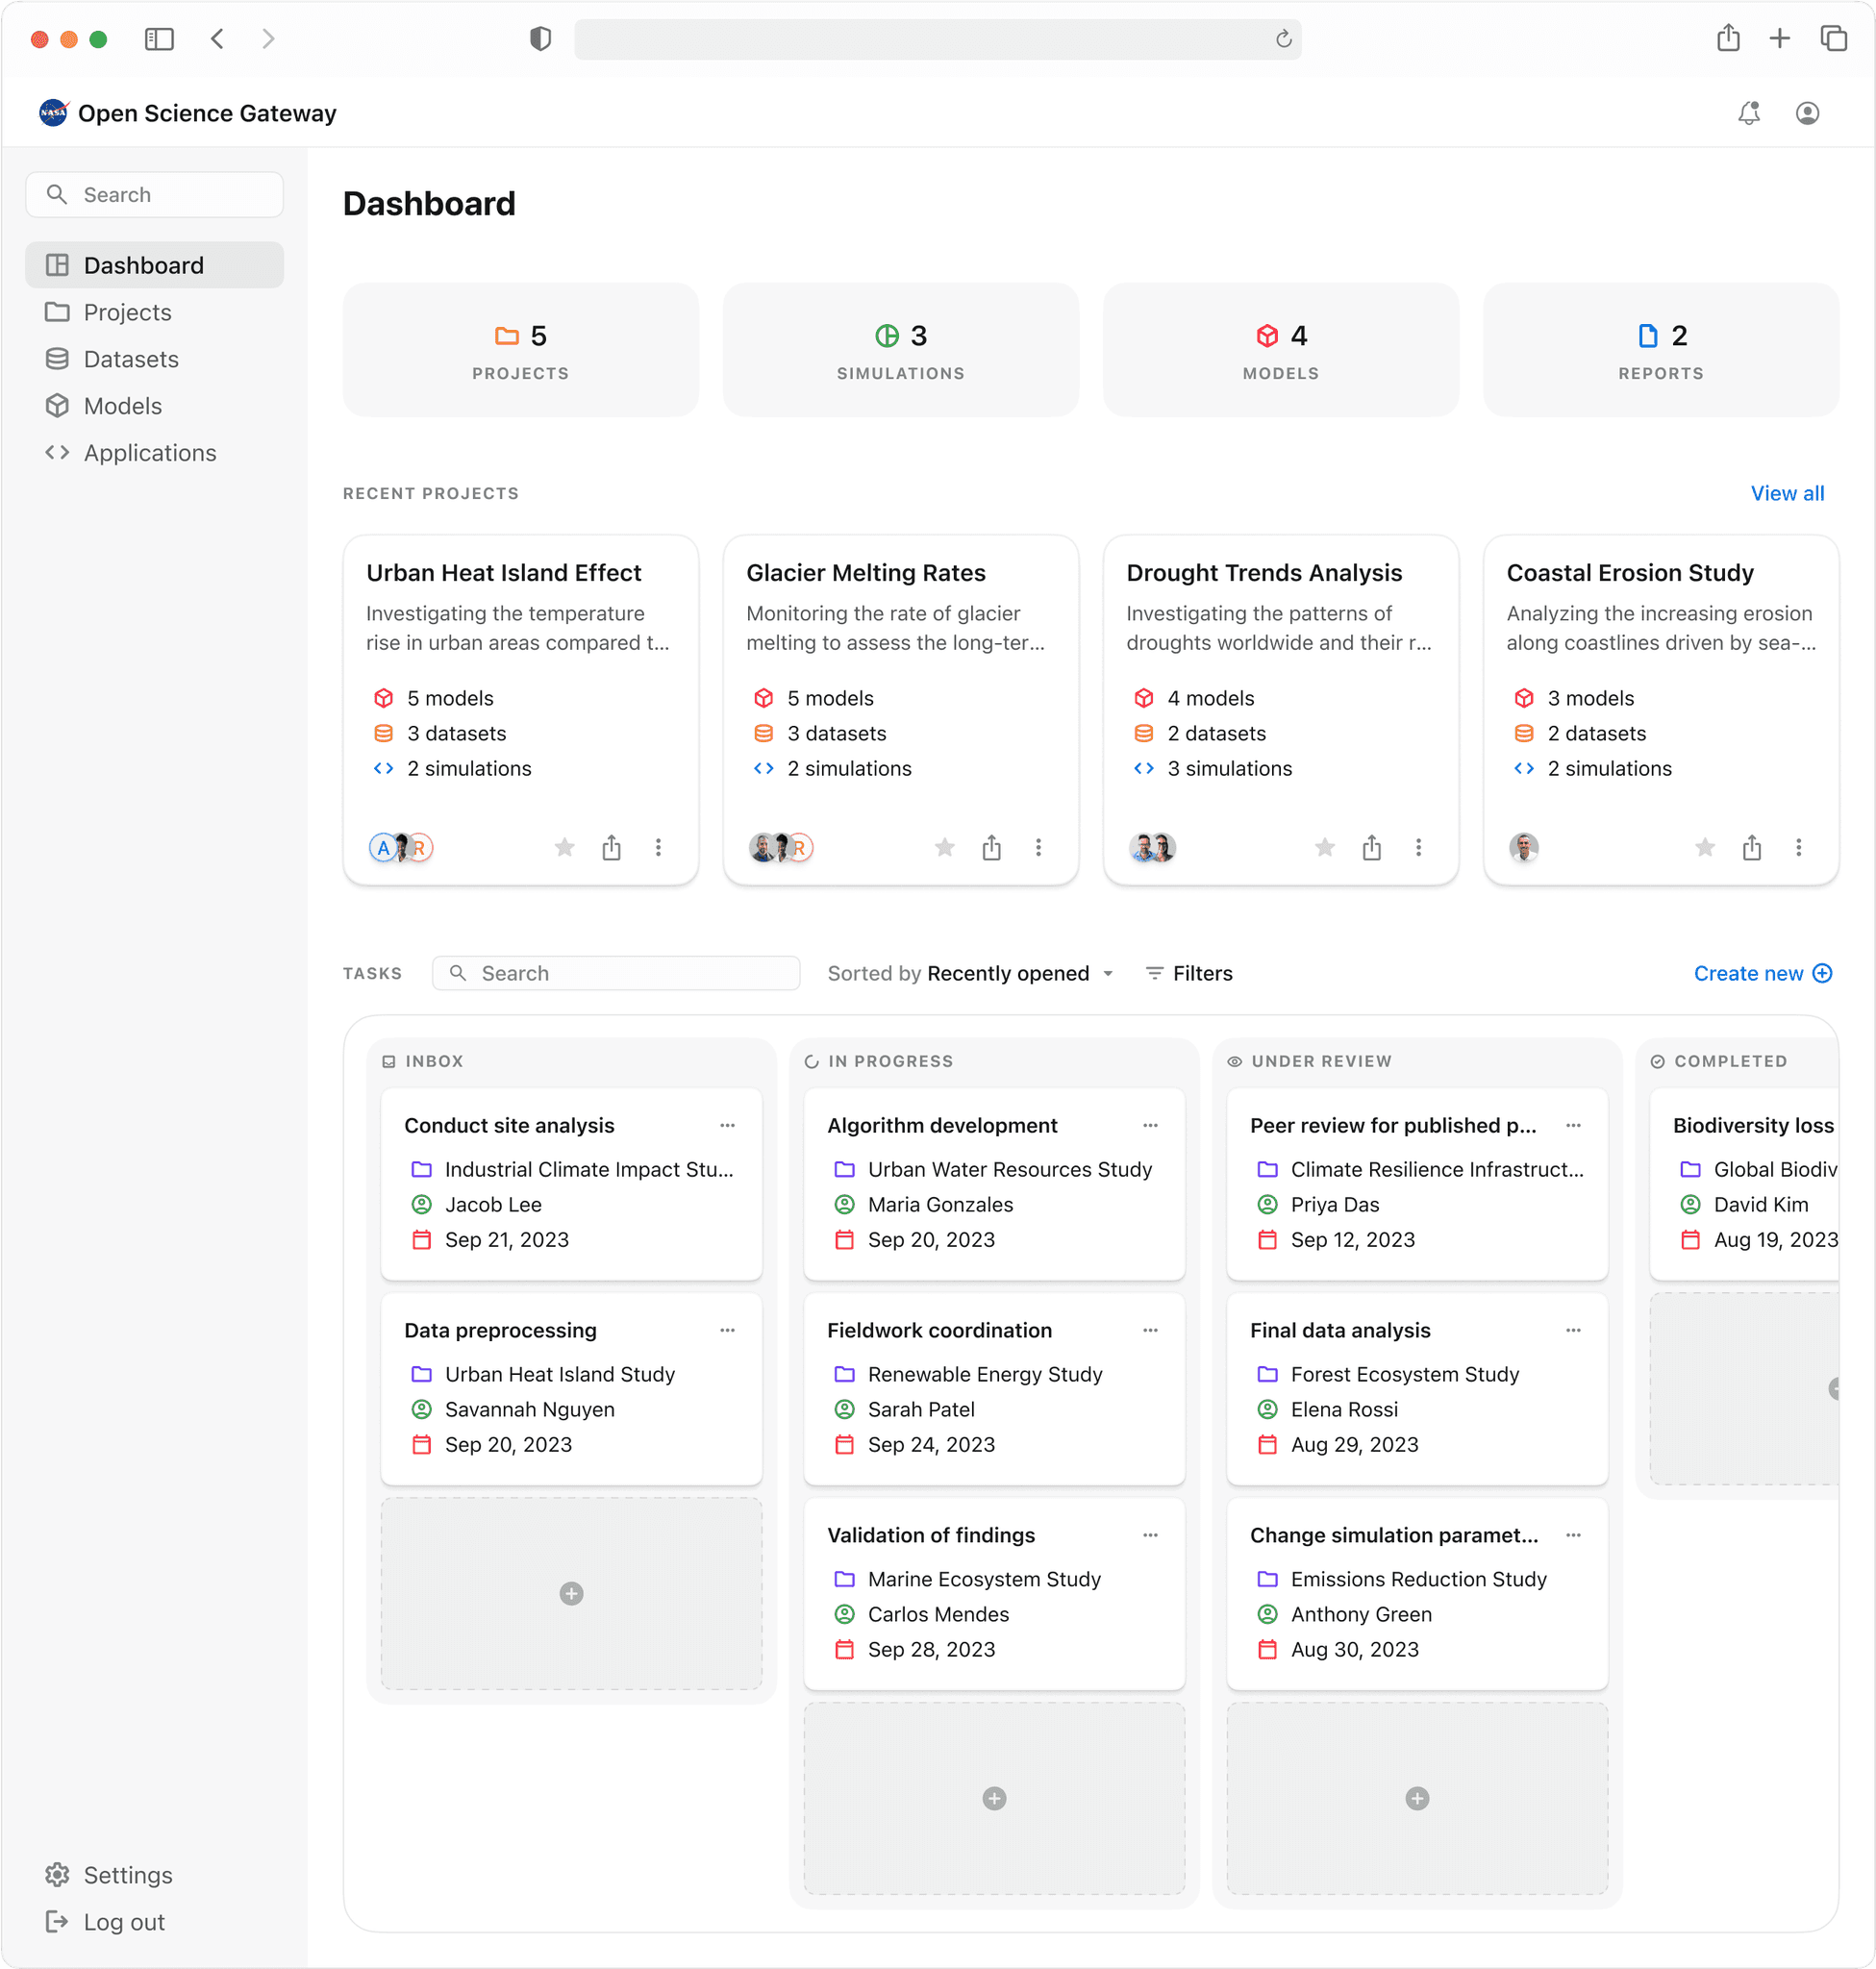
Kanban task management
The dashboard includes a high-level project tracking with detailed task management, allowing scientists to both monitor overall progress and manage day-to-day research activities from a single screen.
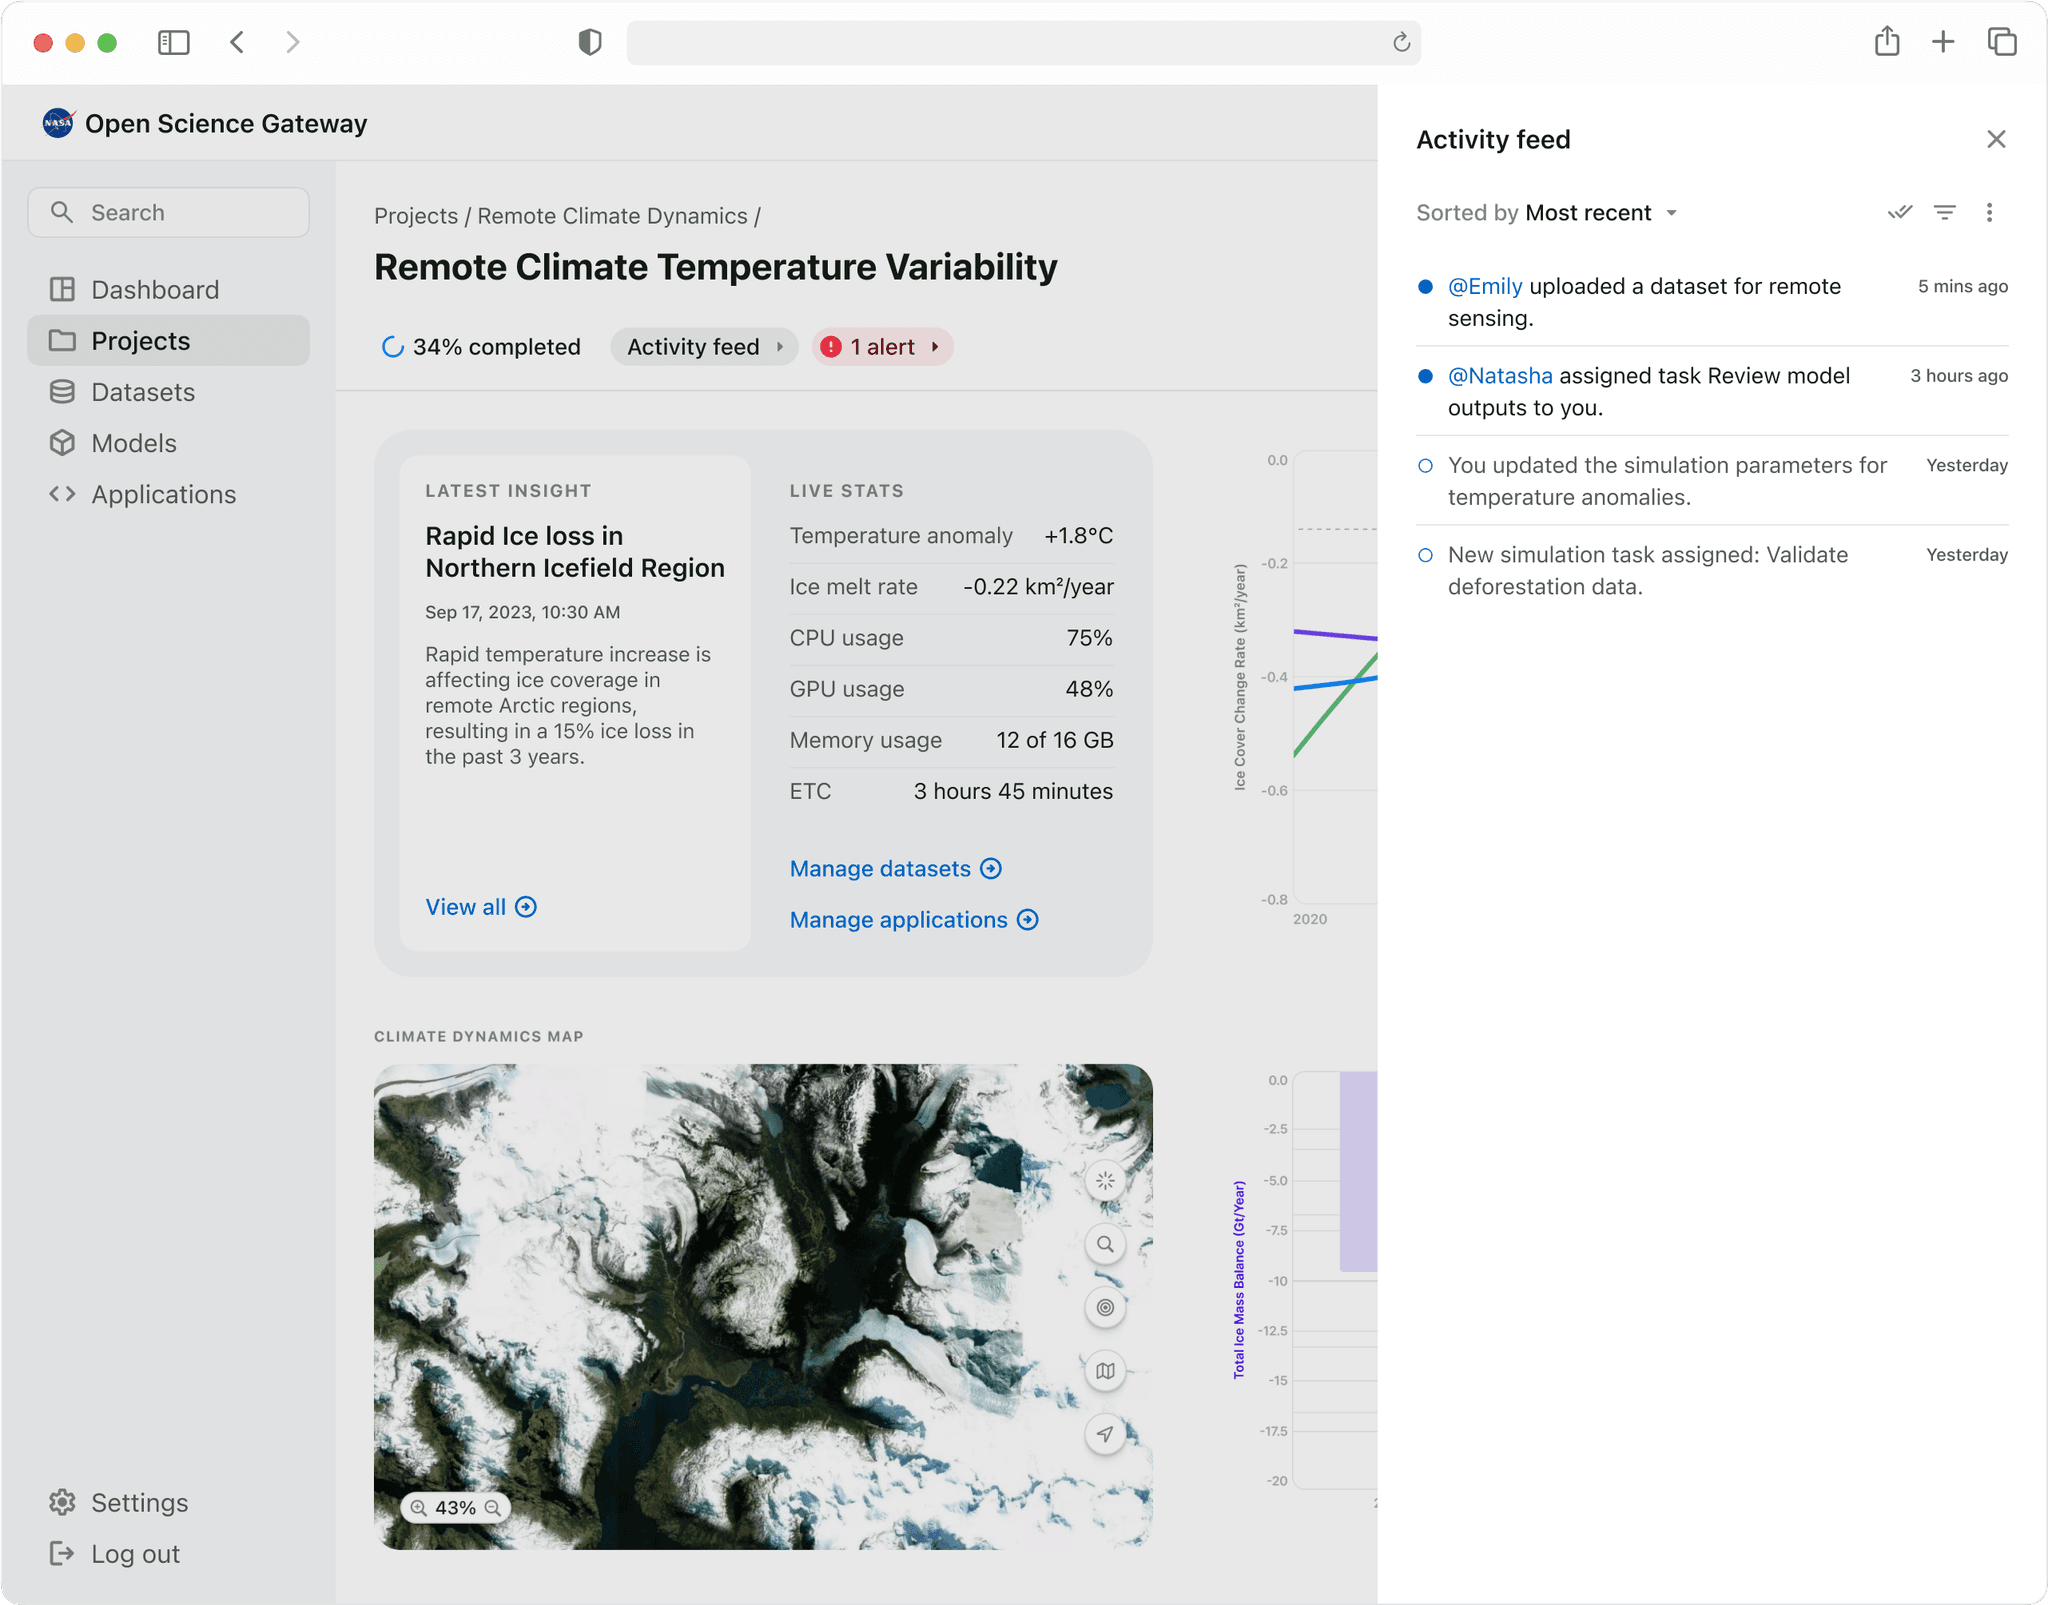
Activity feed
Activity feed allows team members to see updates like newly uploaded datasets, assigned tasks, and simulation progress. This ensures that all collaborators are aligned and can make immediate contributions, improving the overall workflow and decision-making during research projects.
intuitive report generation
Seamless integration of insights
Scientists can compile and publish reports directly within the platform. They can insert insights, charts, and images from the simulations or datasets into their reports simply by dragging them into the document. They can also choose to either insert a detailed analysis or an executive summary.
Testing & impact
We presented the final designs to the geoscientists we initially interviewed and received mixed responses.
I performed a task-based testing exercise with them and received a mixed set of responses. Although they were really impressed by the automation and collaboration features, there were obviously areas for improvement.
"We'd be able to redirect our energy towards innovation, synthesis, and application of our findings, the aspects of our work that truly matter."
– NASA Earth Scientist
Positives
autorenew
Automatic data conversion.
group
Cross-team collaboration management.
pie_chart
Simulation metrics and key insights gathering.
Suggested improvments
apps_outage
UI is too busy; most of the secondary options can be hidden in menus.
quiz
Adding guided tutorials for first-time users.
discover_tune
Provide more flexibility in how much detail users need to provide for certain simulations.
iframe
Not all simulations will have the same process. Need to provide templates for different kinds.
format_shapes
Would like to see more control over the format and content of the report.
Target success metrics
I sat with the PM and the engineers to discuss how we would define success once the MVP ships. We were conservative with our estimates since we had built something novel.

Learnings & reflection
This project was a once-in-a-lifetime opportunity for me, and I feel very lucky to have been a part of it. It felt like I was playing connect-the-dots, but I had to draw the dots myself in order to connect them.
What I learned
tactic
Navigating an opaque and ambiguous space
exposure
Balancing usability & density in interfaces
handshake
Stakeholder management
If I had more time
3p
Conducted cross-domain testing to understand and account for edge cases
checklist
Acted on the suggested improvements
add_circle
Worked on some of the post-MVP features
Current phase
An HTML-based prototype is being used to perform cross-domain testing to make the platform all-encompassing.
Other cases
Back to top
arrow_upward
